What is a context diagram
A model that shows how your product interacts with outside people, organizations, and/or systems. The context diagram helps you to identify the interfaces you need to account for, helps you to identify scope, identify potential stakeholders, and build a better understanding of the context in which you are working.
The context diagram is also known as the context data flow diagram or level 0 data flow diagram.
Elements of a context diagram
Product

The product, system, process, or business entity that is the focus of your initiative is represented by a circle in the context diagram. Anything that is within the control of the initiative to change (processes or job responsibilities) is considered to be inside that circle. People, systems, or organizations that cannot be changed by the initiative are kept outside the circle and are represented as external agents (described below).
For the sake of simplicity, the rest of this technique brief represents this circle as the product of your initiative, or product for short.
If you are using a whiteboard and sticky notes to create a context diagram, draw the product as a circle directly on the whiteboard.
You may find it helpful to note the high level processes performed by the product, but it’s not essential to do so.
External agents

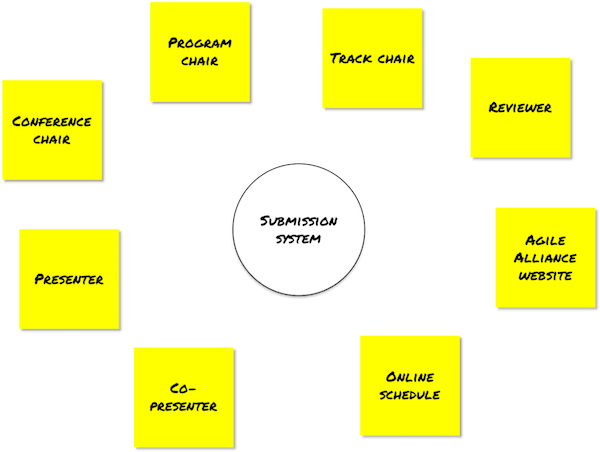
External agents are the people, organizations, and systems that provide data to or consume data from your product.
If you create a context diagram with a whiteboard and sticky notes, you can use sticky notes to represent external agents.
Data flows

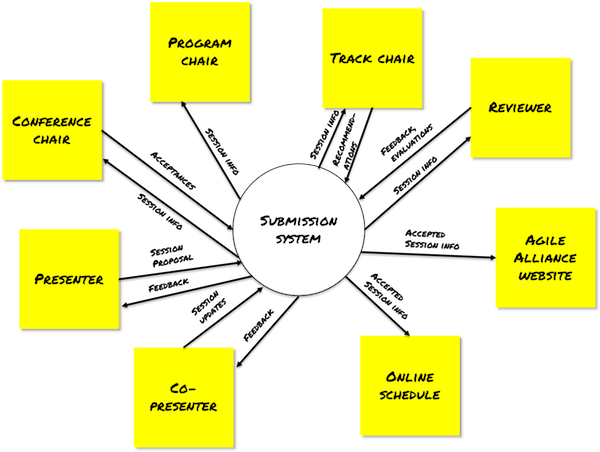
Data flows reflect how your product interacts with external agents via transfer of data.
These data flows represent interfaces which can be implemented in a variety of ways, such as user interfaces, file transfers, reports, or APIs.
A data flow is represented by an arrow and a label that represents the type of data that flows between the entities on the context diagram (your product and the external agents). That label should be a noun or noun phrase and is a general description, not a list of every data element that flows between the entities. If there are multiple types of data flowing in the same direction between two entities, those flows are represented by a single arrow with multiple flows in a comma separated list. It’s helpful to name each data flow uniquely so you can reference each flow individually when you need to further describe those flows.
If you create a context diagram with a whiteboard and sticky notes, draw the data flows directly on the whiteboard.
An Example
This context diagram was put together for the Agile Alliance submission system, a product used by the organization to accept session proposals for its annual conference.
When to use a context diagram
You may find a context diagram helpful if when you:
- start work on a new product that you expect has interactions with existing systems or organizations.
- automate an existing process that has interactions with different systems or organizations. This is a relevant case if you are building a new system or you are implementing a commercial off the shelf (COTS) system
- replace an existing system and you need to identify all the interfaces you have to deal with
- make revisions to an existing system that requires you to add new interfaces or that allows you to remove existing interfaces.
Why use a context diagram
Context diagrams help you structure a conversation and record the resulting information about the interfaces that are relevant for your product. There are three specific benefits that your team can realize by creating context diagrams in a collaborative manner
Build shared understanding
The act of building a context diagram with your team and your key stakeholders can dramatically increase the shared understanding of the environment in which your initiative, and the resulting product exist. In the course of the discussions, you can identify people and organizations that your product interacts with, you can determine what processes and job roles are within the scope of the initiative to create or change.
This shared understanding dramatically helps with the other two benefits listed below.
Identify and agree to scope
A good way to understand the scope of an initiative is to identify the interfaces that you need to deal with. When you collaboratively build a context diagram with your team and key stakeholders, you can identify the various departments within your organization, other organizations and systems that your product relies on for information or that rely on your product for information.
Each of those interactions is an interface that may require work and potentially introduces risk.
When you discuss those interfaces early, even in general terms, you can determine whether you have a source for all the data your product needs and you can identify whether there are people expecting data from your product that you may not have planned on providing.
As you talk through these interfaces, you can also discuss whether all of them are necessary, or whether there are some that are not essential for the product to start delivering value. This helps you to identify opportunities for iterative and incremental delivery of your product. You may also determine during these discussions that some interfaces exist that you could potentially deliver but you choose not to.
In all these cases, the context diagram helps you to identify interfaces and gives you a means to remember which interfaces are relevant for your product and are in and out of scope for your initiative.
Identify stakeholders
A key aspect of creating a context diagram is identifying the external agents that your product interacts with. Once you determine which external agents are relevant you can then identify the people who know the most about those external agents and can provide you with information about data that those external agents provide to your product, or can indicate what those external agents need from your product.
How to use a context diagram
In addition to the process modeling steps below, you may also want to refer to the collaborative modeling technique brief for instructions on how to perform collaborative modeling in general.
Create the context diagram
- Identify the right people to include in the discussion. Include the key stakeholder(s) who started the initiative, the people who will use the product, and the team who will build the product. If you are aware of additional subject matter experts, it’s a good idea to include those people as well. When you identify the people to include make sure you don’t get a group together that is too large to have an effective discussion.
- Gather these individuals together at a whiteboard and get plenty of sticky notes. You want to be able to build the context diagram as you discuss things and change the diagram as you discuss the external agents and data flows and uncover information you didn’t know at the beginning of your discussion. You will change things, and that’s ok. It’s the act of talking through the context that helps people build an understanding and think of things that they didn’t realize at the start of the conversation.
- Identify initial initiative boundary. Draw a circle on the whiteboard and label it with a name that everyone involved in the discussion understands and agrees with. Then identify what general processes and roles exist in side the circle. It may be helpful to note those general processes on the whiteboard as it may trigger some thoughts as to what information the product needs and can provide. Keep in mind that during your discussion you may need to change what is contained within the circle.
- Brainstorm potential external agents Ask everyone involved in the discussion to grab some sticky notes and write down departments, roles, external organizations, business systems or software applications that may provide data to or need data from your product. You can have people do this individually, or have small groups discuss and make separate lists. It’s often helpful to time box this brainstorming activity.
- Create a consolidated list of external agents. After everyone identifies their potential external agents, compile everyone’s lists, remove duplicates, clarify any questions and identify any missing external agents. Put the consolidated set of external agents on the whiteboard around the product. As you place the external agents on the whiteboard, try to place external agents close to each other that may have similar data feeds. (In the Submission System example it makes sense to put presenter and co-presenter close together)

- Identify data flows. Start with an external agent and for each one ask “what data does {external agent} provide to {product}?” If there is data exchanged, draw an arrow from the external agent to the product and label it with a general description of that data. Then ask “what data does {external agent} receive from {product}?” If there is data exchanged, draw an arrow from the product to the external agent and label it with a general description of that data. Repeat this step for every external agent until you have discussed each one.

- Finalize context diagram. When you have finished identifying dataflows, check the context diagram for the following:
- If there are any external agents that do not exchange data with your product, remove those external agents from the diagram.
- If there’s something you thought was an external agent but is actually inside the scope of the initiative, you may find it helpful to put the sticky note representing that person or system inside the circle as a reminder.
- Remove any data flows that are between external agents but do not interact with the product.
- Confirm that there are no missing external agents or data flows.
- Capture your context diagram with a picture. When your discussion is at a stopping point, take pictures of your context diagram so that you can distribute them to the group. If possible, retain the actual context diagram on the whiteboard so that you can have future discussions and revisit the model if new information emerges. If there were people who were not able to join the discussion, review the context diagram with them (preferably in person at the whiteboard, but at least using the pictures). These discussions may reveal new information that drives revisions to your context diagram.
How to use the context diagram to identify backlog items
You can use the context diagram you created to provide a “big picture” view of your initiative and identify backlog items needed to support the product. This exercise can be done at the same time you created the context diagram, or shortly thereafter, depending on how much time you have available.
- Get the right people back together. Include the same people who created the process model.
- Identify backlog items. Provide the group with sticky notes, preferably a different color than what you used to identify external agents. Ask the group to look at each data flow and determine if work is required to realize that data flow. If some work is needed, create a backlog item on a sticky note and place on the diagram next to that data flow. Some interfaces represented by the data flows require work because the interface doesn’t exist. Some interfaces may exist but may require work to make changes being driven by the initiative.
- Review the backlog items. Once your team has identified potential backlog items, ask the team to walk the model and see if there’s anything they think is missing or if they have questions on anything. Have the appropriate discussions and add backlog items that seem to be missing, or remove backlog items that seem extraneous.
- Identify the backlog items that help you reach a specific outcome. Identify a specific outcome that you want to accomplish, most likely an interim step to your overall outcome. Have the team identify the specific backlog items that are absolutely essential to arriving at that outcome with a colored dot or a specifically colored marker. This step allows you to focus on only the backlog items that are essential to accomplishing your desired outcome. A good criteria for your initial pass at identifying backlog items may be only those items required to support the most common scenario you had in mind first when modeling the process. If you have a specific set of outcomes that you would like to deliver incrementally, repeat this step for each outcome.
Caveats and Considerations
I’ve used the approach described in this technique brief to get a better understanding of the interfaces required for a system that supports a business process inside an organization. It assumes that you are going to create a new system, implement a purchased system, or change an existing system. You can use the context diagram for other purposes, such as understanding the data flows for a business process or into and out of a business entity. In those cases, the circle that I referred to as a “product” is more appropriately referenced as the “area under study.” The resulting context diagram is typically used to identify other organizations that you need to establish agreements with in order to exchange information.
As implied elsewhere in this technique brief, a context diagram can be extremely helpful when you implement a COTS package in your organization. Creating the context diagram can help you assess how many interfaces you need to create and can also provide information whether implementing that COTS is feasible and economical.
This technique brief provided a minimal set of simple symbols to use when creating your context diagram. You can use a broader notation if you want to, just make sure you use all the notation consistently and ensure the benefits you get from using specialized notation outweigh the extra time required to ensure consistent use and the potential for confusion from people using the model that aren’t familiar with the notation.
Don’t feel the need to use an electronic tool to create the context diagram if you don’t need to. Sometimes the hand drawn variety can be more useful. It depends somewhat on what your intended use of the context diagram is. The collaborative by hand approach described in this technique brief is based on the idea that there is often more value in the discussions you have when creating the context diagram than in the model itself.
Additional Resources
Context Diagram – BAwiki
What is a Context Diagram and what are the benefits of creating one? – ModernAnalyst.com
Process Modeling: Context Diagrams & Data Flow Diagrams (DFDs) – University of Texas MIS374 course materials
